
Kirk Shanahan, Can You Explain This? (He Couldn’t)
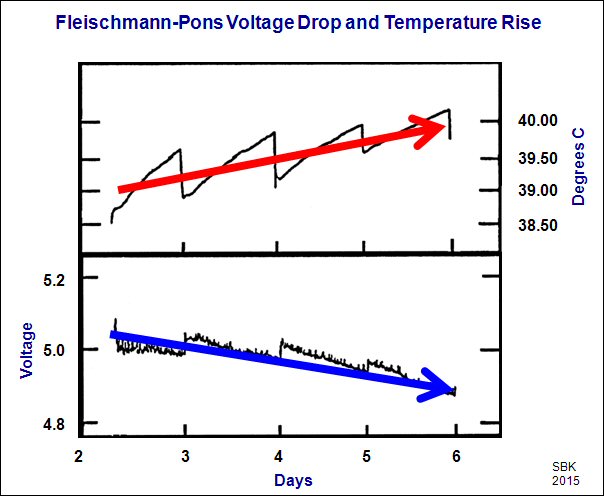
(Blue and red arrows added by SBK) Graph is figure 1 from Fleischmann, Martin and Pons, Stanley, “Calorimetry of the Pd-D2O System; From Simplicity Via Complications to Simplicity,” Physics Letters A , 176, p. 118, (1993) (Similar paper)
Kirk Shanahan is a physical chemist employed by the U.S. Department of Energy’s Savannah River National Laboratory. As this Freedom of Information Act request response shows, he spends a large amount of time attempting to discredit low-energy nuclear reaction research claims.
I published the graph above in my recent White Paper “Power Generation Via LENRs.” I received a response regarding the graph from Einar Tennfors, a retired Swedish plasma physicist. He claimed that the anomaly shown in the graph, an increase in LENR cell temperature concurrent with a decrease in input power, was easily explained by conventional science.
Tennfors said the temperature rise was due to increased conductivity in the cell. I asked him what causes the cell conductivity to increase. He said ion mobility increases with temperature. I asked him what causes the temperature rise that causes the ion mobility to increase. He said the heating is due to the interaction between the ion current and the surrounding ions.
I decided to seek a critic who could attempt a better argument. Shanahan was the man.
May 1, 2017, Krivit
Can you explain, by any known scientific process, how the input power drops while the cell temperature increases?
May 2, 2017, Shanahan
1. First a recap. The Figure you chose to present is the first figure from F&P’s 1993 paper on their calorimetric method. It’s overall notable feature is the saw-tooth shape it takes, on a 1-day period. This is due to the use of an open cell which allows electrolysis gases to escape and thus the liquid level in the electrolysis cell drops. This changes the electrolyte concentration, which changes the cell resistance, which changes the power deposited via the standard Ohm’s Law relations, V= I*R and P=V*I (which gives P=I^2*R). On a periodic basis, F&P add makeup D2O to the cell, which reverses the concentration changes thus ‘resetting’ the resistance and voltage related curves.
2. Note that Ohm’s Law is for an ‘ideal’ case, and the real world rarely behaves perfectly ideally, especially at the less than 1% level. So we expect some level of deviation from ideal when we look at the situation closely. However, just looking at the temperature plot we can easily see that the temperature excursions in the Figure change on Day 5. I estimate the drop on Day 3 was 0.6 degrees, Day 4 was 0.7, Day 5 was 0.4 and Day 6 was 0.3 (although it may be larger if it happened to be cut off). This indicates some significant change (may have) occurred between the first 2 and second 2 day periods. It is important to understand the scale we are discussing here. These deviations represent maximally a (100*0.7/303=) 0.23% change. This is extremely small and therefore _very_ difficult to pin to a given cause.
3. I also note that the voltage drops follow a slightly different pattern. I estimate the drops are 0.1, .04, .04, .02 V. The first drop may be artificially influenced by the fact that it seems to be the very beginning of the recorded data. However, the break noted with the temperatures does not occur in the voltages, instead the break _may_ be on the next day, but more data would be needed to confirm that. Thus we are seeing either natural variation or process lags affecting the temporal correlation of the data.
4. I also note that in the last day’s voltage trace there is a ‘glitch’ where the voltage take a dip and changes to a new level with no corresponding change in cell temp. This is a ‘fact of the data’ which indicates there are things that can affect the voltage but not the temperature, which violates our idea of the ideal Ohmic Law case. But we expected that because we are dealing with such small changes.
5. Baseline noise is substantially smaller than these numbers, and I can make no comments on anything about it.
6. Your point in adding the arrows to the Figure seems to be that the voltage is drifting down overall, so power in should be drifting down also (given constant current operation). Instead the cell temperature seem to be drifting up, perhaps indicating an ‘excess’ or unknown heat source. F&P report in the Fig. caption that the calculated daily excess heats are 45, 66, 86, and 115 milliwatts. (I wonder if the latter number is somewhat influenced by the ‘glitch’ or whatever caused it.) Note that a 45 mW excess heat implies a 0.1125V change (P=V*I, I= constant 0.4A), and we see that the observed voltage changes are too small and in the wrong direction, which would indicate to me that the temperatures are used to compute the supposed excesses. The derivation of these excess heats requires a calibration equation to be used, and I have commented on some specific flaws of the F&P method and on the fact that it is susceptible to the CCS problem previously. The F&P methodology lumps _any_ anomaly into the ‘apparent excess heat’ term of the calorimetric equation. The mistake is to assign _all_ of this term to some LENR. (This was particularly true for the HAD event claimed in the 1993 paper.)
7. Using an average cell voltage of 5V and the current of 0.4A as specified in the Figure caption (Pin~=2W), these heats translate to approximately 2.23, 3.3, 4.3, and 7.25% of input. Miles has reported recombination in his cells on the same order of magnitude. Thus we would need measures of recombination with accuracy and precision levels on the order of 1% to distinguish if these supposed excess heats are recombination based or not _assuming_ the recombination process does nothing but add heat to the cell. This may not be true if the recombination is ATER (at-the-electrode-recombination). As I’ve mentioned in lenr-forum recently, the 6.5% excess reported by Szpak, et al, in 2004 is more likely on the order of 10%, so we need a _much_ better way to measure recombination in order to calculate its contribution to the apparent excess heat.
8. This summarizes what we can get from the Figure. Let’s consider what else might be going on in addition to electrolysis and electrolyte replenishment. There are several chemical/physical processes ongoing that are relevant that are often not discussed. For example: dissolution of electrode materials and deposition of them elsewhere, entrainment, structural changes in the Pd, isotopic contamination, chemical modification of the electrode surfaces, and probably others I haven’t thought of at this point.
9. All except the entrainment issue can result in electrode surface changes which in turn can affect the overvoltage experienced in the cell. That in turn affects the amount of voltage available to heat the electrolyte. In other words, I believe the correct, real world equation is Vcell = VOhm + Vtherm + Vover + other. (You will recall that the F&P calorimetric model only assumes VOhm and Vtherm are important.) It doesn’t take much change to induce a 0.2-0.5% change in T. Furthermore most of the significant changing is going to occur in the first few days of cell operation, which is when the Pd electrode is slowly loaded to the high levels typical in an electrochemical setup. This assumes the observed changes in T come from a change in the electrochemical condition of the cell. They might just be from changes in the TCs (or thermistors or whatever) from use.
10. Entrainment losses would affect the cell by removing the chemicals dissolved in the water. This results in a concentration change in the electrolyte, which in turn changes the cell resistance. This doesn’t seem to be much of an issue in this Figure, but it certainly can become important during ATER.
[Paragraphs not directly addressing this measurement removed.]
I readily admit I make mistakes, so if you see one, let me know. But I believe the preceding to be generically correct.
Kirk Shanahan
Physical Chemist
U.S. Department of Energy, Savannah River National Laboratory
May 2, 2017, Krivit
Dear Kirk,
My question to you was, specifically referring to Fig. 1 in the 1993 Fleischmann-Pons Physics Letters A paper, “can you explain, by any known scientific process, how the input power drops while the cell temperature increases?” Your first response, on April 28, was “probably.” Your second response, received on May 2, is much more detailed.
I would like to thank you for taking the time to carefully analyze this reported result. I appreciate your willingness to attempt to explain this apparent anomaly. It is only through rigorous scrutiny that scientific results can be considered for acceptance.
Although you have offered a lot of information, for which I’m grateful, I am unable to locate in your letter any definitive, let alone probable conventional explanation as to why the overall steady trend of increasing heat and decreasing power occurs, violating Ohm’s law, unless there is a source of heat in the cell. The authors of the paper claim that the result provides evidence of a source of heating in the cell. As I understand, you deny that this result provides such evidence.
Paragraph 1: I am in agreement with your description of the cell behavior as reflected in the sawtooth pattern. We are both aware that that is a normal condition of electrolyte replenishment. As we both know, the reported anomaly is the overall steady trend of the temperature rise, concurrent with the overall trend of the power decrease.
Paragraph 2: This is a granular analysis of the daily temperature changes. I do not see any explanation for the anomaly in this paragraph.
Paragraph 3: This is a granular analysis of the daily voltage changes. I note your use of the unconfident phrase “may be” twice. I do not see any explanation for the anomaly in this paragraph.
Paragraph 4: You mention what you call a glitch, in the last day’s voltage trace. It is difficult for me to see what you are referring to, though I do note again, that you are using conditional language when you write that there are things that “can affect” voltage. So this paragraph, as well, does not appear to provide any explanation for the anomaly. Also in this paragraph, you appear to suggest that there are more-ideal cases of Ohm’s law and less-ideal cases. I’m unwilling to consider that Ohm’s law, or any accepted law of science, is situational.
Paragraph 5: You make a comment here about noise.
Paragraph 6: You analyze the reported daily excess heat measurements as described in the Fleischmann-Pons paper. I was very specific in my question. I challenged you to explain the apparent violation of Ohm’s law. I did not challenge you to explain any reported excess heat measurements or any calorimetry. Readings of cell temperature are not calorimetry, but certainly can be used as part of calorimetry.
Paragraph 7: You discuss calorimetry.
Paragraph 8: You offer random speculations of other activities that might be going on inside the cell.
Paragraphs 9-10: You consider entrainment, but you don’t say how this explains the anomaly.
Let me again thank you for taking the time to analyze this reported result and respond. I cannot see any obvious mistakes in what you’ve written; perhaps an electrochemist may find some. However, you’ve offered not a single definitive, let alone probable conventional explanation for this reported thermal anomaly.
This concludes my discussion of this matter with you.
Steven B. Krivit
New Energy Times
May 3, 2017, From Electrochemist Melvin Miles
I have not studied this in detail, but Shanahan is wrong in his application of Ohm’s Law to electrochemistry. The current and voltage relationship is not simply by Ohm’s Law. For example, the cell voltage involves various factors including the equilibrium cell potential based on the cell reaction, the overvoltage at the anode, the overvoltage at the cathode (both depend on the electrode kinetics), and the IR drop across the cell. This will look somewhat like Ohm’s Law only if the IR voltage is much larger than the other components. Actually, at the large currents used in the F-P experiments, there is an exponential relationship between the cell current and the overvoltages at the anode and the cathode and not an Ohm’s Law relationship.
