
ORNL Nuclear Cavitation – The Half-Truth of the 1 Percent (Part 9)

Oak Ridge Nuclear Cavitation Confirmation
July 26, 2013 – By Steven B. Krivit –
This is Part 9 of “2001 Oak Ridge Nuclear Cavitation Confirmation Uncovered.”
This is a New Energy Times Special Report. The first part of this series published on July 18, 2013.
The Half-Truth of Shapira and Saltmarsh’s 1 Percent (March 2002)
When Shapira and Saltmarsh spoke to the news media after the news of the Taleyarkhan group’s paper went public, they said they saw “no evidence for any excess neutrons” and that the excess neutrons they did see (logical contradiction notwithstanding) were trivial, only 1 percent higher than background.
In speaking with the media, they omitted two crucial concepts: the standard deviation and the counting method. The standard deviation represents the scientifically significant level of confidence of the magnitude of an effect. In this case, the magnitude was 1 percent. But was 1 percent significant, and did it confirm or disconfirm the Taleyarkhan group’s claim?
First, let’s go back to Shapira and Saltmarsh’s July 2001 internal reports. They mentioned nothing about excess neutrons, let alone a 1 percent value, or a suggestion that 1 percent was scientifically insignificant.
The first time that they mentioned “excess neutrons” in their papers was after the Taleyarkhan group figured out, thanks to the raw data, that Shapira and Saltmarsh’s detector measured an excess.
In February, Shapira and Saltmarsh wrote that they observed “about 1,000” excess neutrons. In March, their story to the news media changed to “no evidence for any excess neutrons.”
In February, Shapira and Saltmarsh wrote that they had observed a “statistically significant difference.” In March, their story to the news media changed to a seemingly trivial 1 percent.
The magnitude of any claimed effect can be meaningless without the standard deviation (SD.) For example, if researchers measure the production of 1 Watt of excess heat in an experiment but the uncertainty is 1 Watt, then they may have produced no excess heat; their signal is meaningless.
On the other hand, if researchers measure the production of 1 Watt of excess heat in an experiment but their uncertainty is 1 milliWatt, then although 1 Watt isn’t technologically significant, it is significant scientifically. In other words, it is statistically significant — and valid.
As a result of the standard deviation, Shapira and Saltmarsh knew that even a 1 percent difference in neutrons was statistically significant. That’s why they said so in their document. When they spoke to the news media, however, they omitted the SD.
In an e-mail to New Energy Times, West calculated the statistical significance of Shapira and Saltmarsh’s data. Based on the pair’s neutron counting decision, he arrived at a difference (an increase) in neutron counts of three standard deviations – a scientifically valid statement and result.
The Right Time to Count Neutrons
But there are different ways to count the neutrons, and the Taleyarkhan group explained this in its March 2, 2002, rebuttal. A more accurate way than the one used by Shapira and Saltmarsh is to count neutrons only during the time you would expect to find neutrons, and not include periods of expected dead time. A basic understanding of the reaction sequence is required.
The pulsed neutron generator emits bursts of 14 MeV neutrons which, if they strike atoms in the liquid in the acoustic chamber, create microscopic bubbles. Because the neutron bursts are precisely timed to occur when the ultrasonic wave, induced in the chamber by a piezoelectric ring, is putting the liquid that is near the center of the chamber under tension, those bubbles immediately begin to grow. Within 30 microseconds, they begin to implode. The implosion brings with it SL flashes, acoustic pressure waves, and the formation of tritons or neutrons.
The diagram of the timing window below gives the crucial part of the sequence. The full sequence is slightly more complicated. The fluid is nucleated and the bubble grows during the first 30 microseconds after the PNG fires. At the moment the bubble implodes, it emits the SL flash and neutron. The timing gap allows the researchers to differentiate between neutrons emitted from the PNG and neutrons emitted from the test chamber. This is another reason Shapira and Saltmarsh’s demand for coincidence data is less relevant than they imply.
The chart below shows the aggregated count of the neutrons measured by Shapira and Saltmarsh, emitted from the Taleyarkhan group’s June 24, 2001, experiment. The chart is based on the Taleyarkhan group’s 2004 paper in Physical Review E, figure 7a. Naturally, there will be no excess neutrons during the first 30 microseconds as the bubbles form. The SD, indicated by the error bars, shows the neutron count during the 5- to 20-microsecond window when the PNG fires as effectively null. Starting at 31 microseconds, when the implosions begin, the neutrons appear.
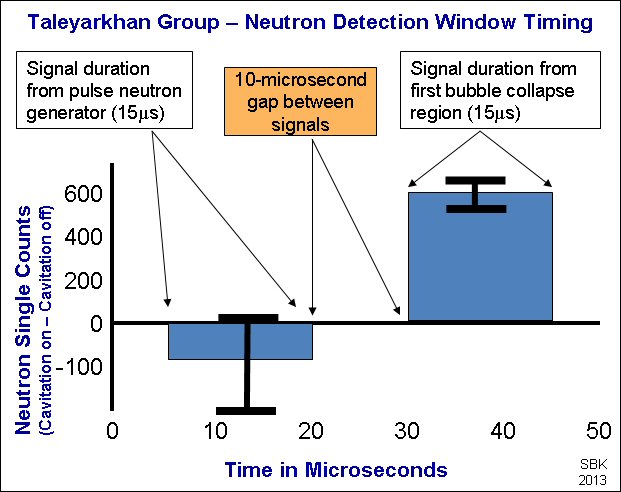
Neutron Detection Window Timing
The chart below, Figure 2a from reference #32 from the Taleyarkhan group’s 2002 Science paper, looks at various segments of the time sequence in greater detail. The aggregated peak of neutrons occurs right after the implosions begin, and then they drop off.
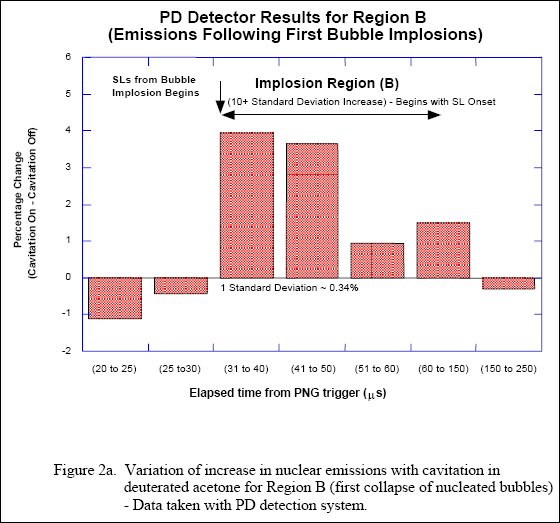
Taleyarkhan group’s excess neutrons as measured by Shapira and Saltmarsh
At the peak, there is a 4 percent aggregated excess of neutrons during cavitation compared with neutrons when cavitation is off. During the 31- to 150-microsecond phase of the bubble collapse, the Taleyarkhan group calculated a significant increase using the data collected by Shapira and Saltmarsh.
“Statistically significant (over 10 SD) neutron/nuclear emissions were observed in the PD [measurements],” the Taleyarkhan group wrote.
So how did Shapira and Saltmarsh get a value of 1 percent excess rather than 4 percent excess, as shown above during the period immediately following bubble collapse? They averaged the detected neutron fluxes over the entire time sequence, including the time during bubble formation when there should not have been any neutron flux and the long time durations when no bubble implosion took place. Using their calculation method, the average of the seven periods shown above comes to 1.17 percent excess.
In their 2004 paper, the Taleyarkhan group displayed a finer resolution of the time sequence in the first five microseconds after implosion. In the chart below, the entire time window, inclusive of channels 1 through 1,000, is 5 milliseconds long. The difference between cavitation off and cavitation on becomes remarkably clear.
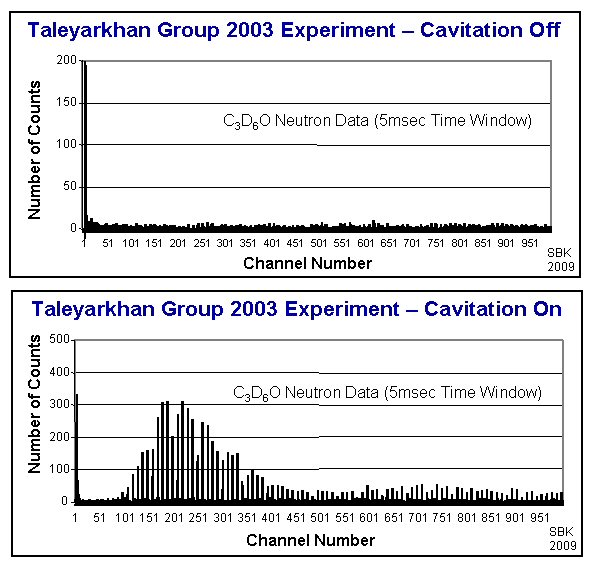
Taleyarkhan group’s excess neutrons measured in a 5 millisecond window
Next Part: Shapira-Saltmarsh Stand by Their Data
Questions? Comments? Submit a Letter to the Editor.
